The i-Sense continually monitors the line and calculates RMS values, then collects these values every 10 minutes:
AVERAGE -- the average RMS voltage over the whole 10-minute interval
MIN -- the minimum half-cycle RMS voltage over the 10-minute interval
MAX -- the maximum half-cycle RMS voltage over the 10-minute interval
When 32 of these intervals have been collected, a "Periodic RMS" event is posted.
Click on the Periodic RMS event ID number in the event list to see the long-term voltage profile.
Longer-term voltage profiles and voltage regulation and unbalance charts are available
in the PDF reports.
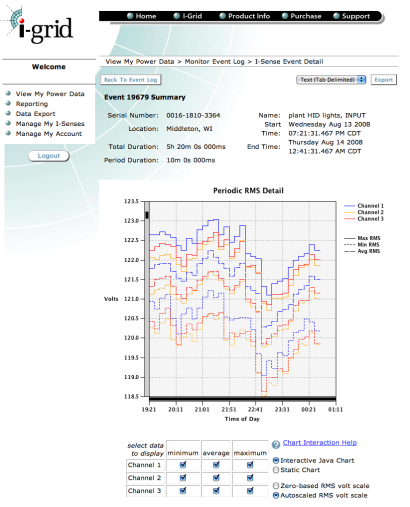
Periodic RMS Event Detail Page
The page header includes timestamp and duration of the event and monitor
details. You can also export the single event to Excel, XML or PQDIF for further analysis.
The Periodic RMS Detail chart displays the min/max/avg
RMS value over 10 minute periods. Using the interactive
chart viewing feature, you can zoom in on specific data points.
You can choose specific channels and data types
(i.e. min/max/avg) to customize the chart view