Event Criteria & Classification Help
Several sections of the i-Grid allow you to search for power quality events matching a set of
criteria.
Searches can be limited by the geographical location of the monitor, the severity and time
duration of the power quality event, and by when the power quality event occurred.
The i-Grid system classifies the severity of a power quality event according to the
IEEE 1159 specification,
"IEEE Recommended Practice on Monitoring Electrical Power Quality",
IEEE Standard Number 1159-1995, ISBN 1-5593-7549-3,
available from the IEEE Standards Association,
as extended by IEEE draft proposal 1159.1,
and further extended by Rockwell Automation/SoftSwitching in order to fill gaps in the proposed standard.
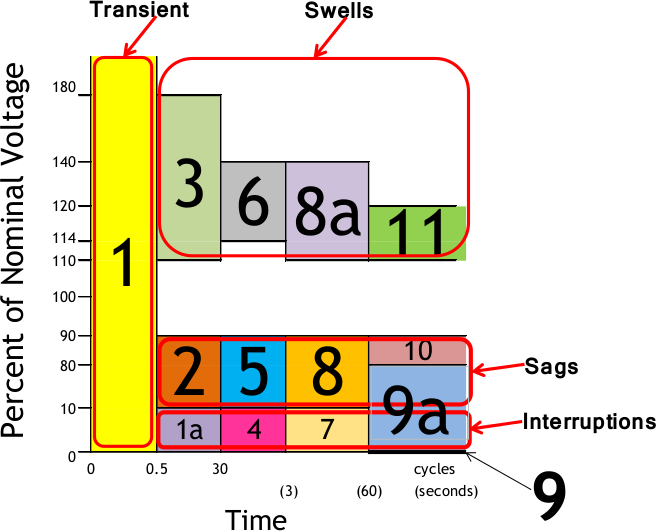
Our classification scheme is defined by the following diagram and table.
Note in the diagram how the event criteria checkboxes for sags, swells, interruptions, and transients
align with the event classification scheme.
* Classifications added by Rockwell Automation/SoftSwitching
Duration
|
Voltage
(percent of nominal) |
Classification
|
Diagram #
|
Transient
|
under
0.5 cycle
|
any detected event
|
Transient
|
1
|
Instantaneous
|
0.5 cycle
to
30 cycles
|
< 10%
|
Instantaneous Interruption*
|
1a
|
10% to 90%
|
Instantaneous Sag
|
2
|
90% to 110%
|
nominal
|
> 110%
|
Instantaneous Swell
|
3
|
Momentary
|
30 cycles
to
3 seconds
|
< 10%
|
Momentary Interruption
|
4
|
10% to 90%
|
Momentary Sag
|
5
|
90% to 115%
|
nominal
|
> 115%
|
Momentary Swell
|
6
|
Temporary
|
3 seconds
to
1 minute
|
< 10%
|
Temporary Interruption
|
7
|
10% to 90%
|
Temporary Sag
|
8
|
90% to 110%
|
nominal
|
> 110%
|
Temporary Swell*
|
8a
|
Sustained
|
over
1 minute
|
0
|
Sustained Interruption
|
9
|
1% to 80%
|
Sustained Deep Undervoltage*
|
9a
|
80% to 90%
|
Sustained Undervoltage
|
10
|
90% to 110%
|
nominal
|
> 110%
|
Sustained Overvoltage
|
11
|
|